Validation Note
This recipe is available via AutoAssess.
Overview
This is a generic assessment that can use a large number of model diagnostics and compares two experiments with an appropriate observation for context. The general diagnostic plot is a “4up” showing:
Reference field
Experiment - Reference difference
Reference - Observation difference
Experiment - Observation difference
If the model diagnostic does not lend itself to this format then other variations plot can be used, see examples.
Available recipes and diagnostics
The assessment code is available from the AutoAssess repository.
User settings in recipe
There are no user settings for this recipe
Variables
Any available model diagnostic as either an annual or seasonal multi-annual mean.
Observations and reformat scripts
A large number of observations are used for this assessment and are appropriate for the model diagnostic being compared.
References
There are no references for this assessment
Example plots
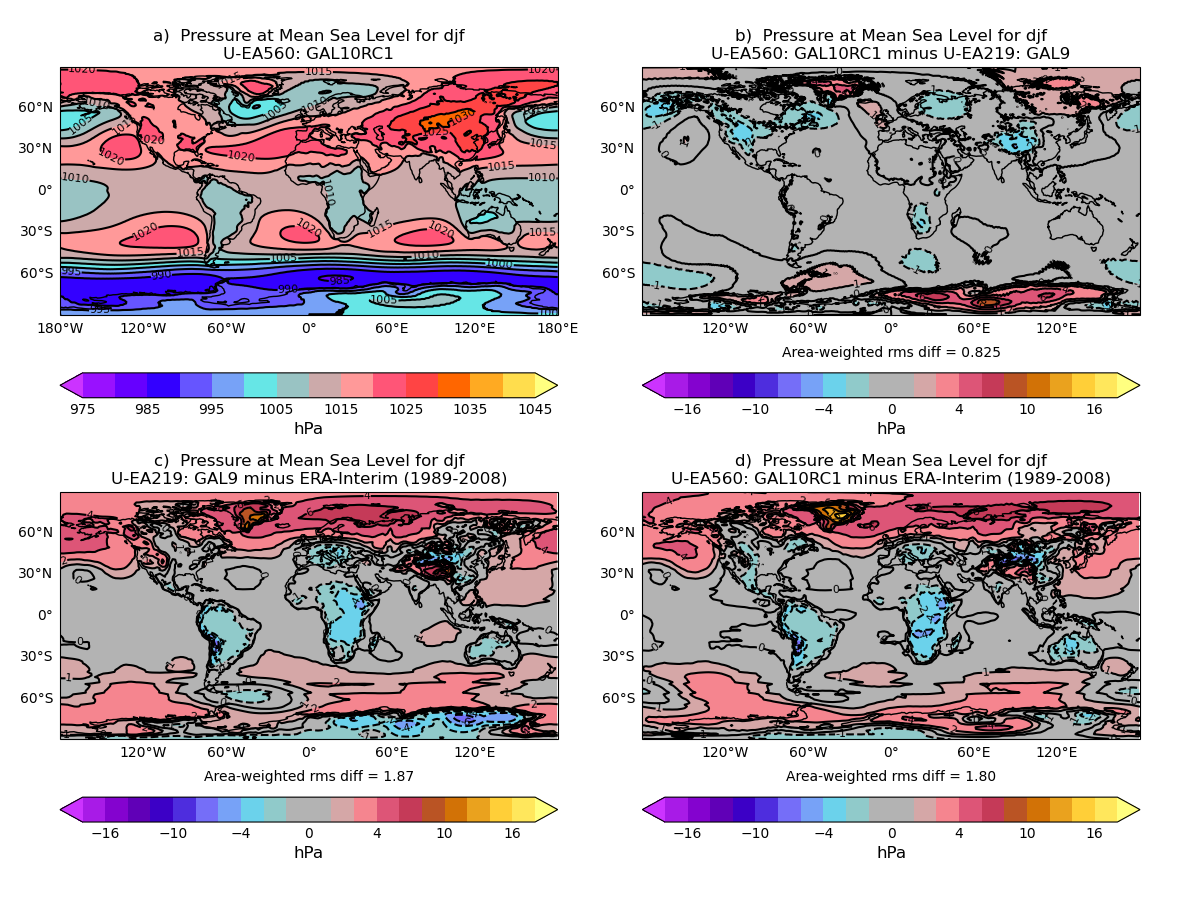
Comparison of PMSL to ERA-Interim
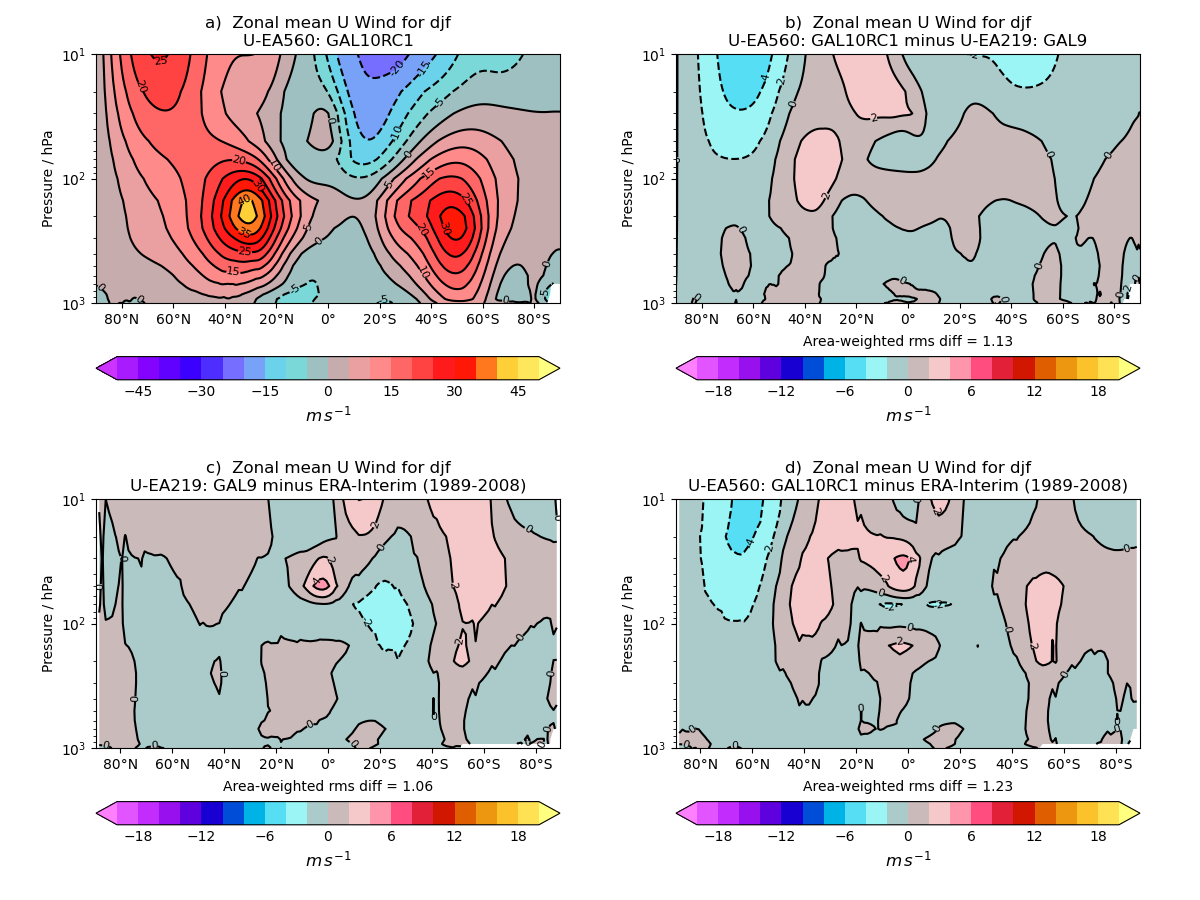
Comparison of zonal mean zonal wind to ERA-Interim using log(pressure) Y axis
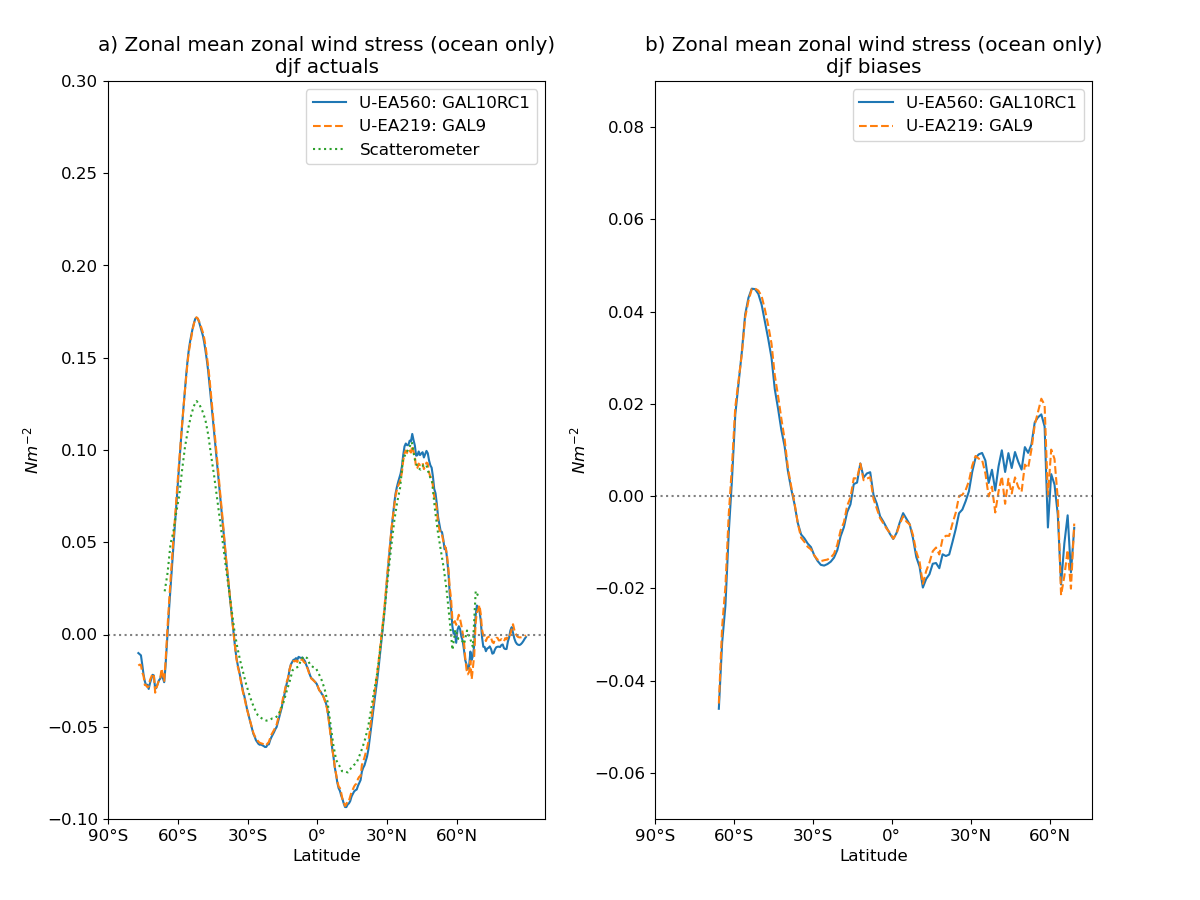
Comparison of surface wind stress to scatterometer
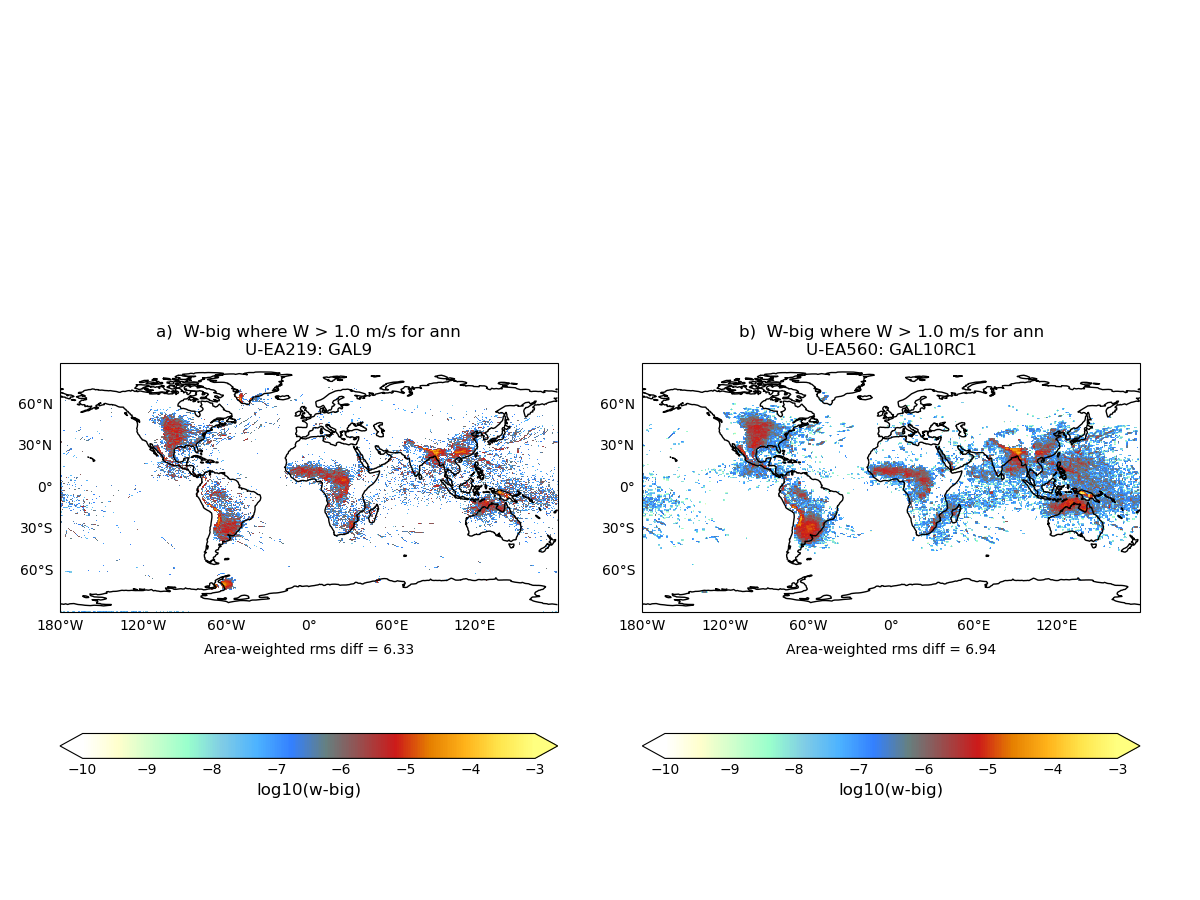
Comparison of instances of vertical velocities > 1 ms-1