El Niño-Southern Oscillation
This recipe is available via AutoAssess.
Overview
ENSO
Available recipes and diagnostics
The assessment code is available from the AutoAssess repository.
Definition of Nino regions: Nino 1+2 (0-10S, 90W-80W), Nino 3 (5N-5S, 150W-90W), Nino 3.4 (5N-5S, 170W-120W), Nino 4 (5N-5S, 160E-150W)
Performance metrics:
Standard deviation of Nino3 sea surface temperature (SST) anomalies
Standard deviation of Nino4 SST anomalies
Nino3 SST anomaly power spectrum in 3-7 year frequency range
Standard deviation of Nino4 precipitation anomalies
Annual mean Nino3 SST
Annual mean Nino4 zonal wind stress (TAUX)
Standard deviation of Nino3 SST annual cycle
Correlation of Nino3 SST and Southern Oscillation Index (mean sea level pressure anomaly, Tahiti minus Darwin)
Diagnostics:
Time series for sea surface temperature for areas Nino1+2, Nino3, Nino3.4 and Nino4
Annual mean sea surface temperature (5N-5S) and zonal wind stress (5N-5S) for Pacific longitudes
Seasonal cycle of standard deviation of Nino3 sea surface temperature “phase locking”
Nino3 sea surface temperature power spectrum
Composite sea surface temperature (tropical Pacific) for DJF and JJA for El Nino (Nino3.4>0.8) and La Nina (Nino3.4<0.8) composites
Composite MSLP anomalies (global) for DJF and JJA for El Nino and La Nina
Composite MSLP anomalies (N. Hem) for JFM (late winter) for El Nino and La Nina
Composite precipitation anomalies (global) for DJF and JJA for El Nino and La Nina
Likelihood of impact for selected regions for 1.5m temperature and precipitation
User settings in recipe
There are no user settings for this recipe
Variables
Variable/Field name |
realm |
frequency |
|---|---|---|
Sea surface temperature |
Atmosphere |
monthly mean |
TAUX |
Atmosphere |
monthly mean |
Precipitation |
Atmosphere |
monthly mean |
Mean sea level pressure |
Atmosphere |
monthly mean |
1.5m temperature |
Atmosphere |
monthly mean |
Observations and reformat scripts
Sea surface temperature: HadISST Zonal mean wind stress: NOC, MERRA Mean sea level pressure: NCEP reanalysis Precipitation: CMAP, GPCP Near surface temperature: NCEP reanalysis
How to obtain the data:
All data can be downloaded free of charge
References
Bellenger, H., Guilyardi, É., Leloup, J., Lengaigne, M. and Vialard, J., 2014. ENSO representation in climate models: from CMIP3 to CMIP5. Climate Dynamics, 42(7-8), pp.1999-2018.
Davey, M. K., A. Brookshaw, and S. Ineson, 2014: The probability of the impact of ENSO on precipitation and near-surface temperature. Climate Risk Management, 1, 5-24, doi:10.1016/j.crm.2013.12.002.
Example plots
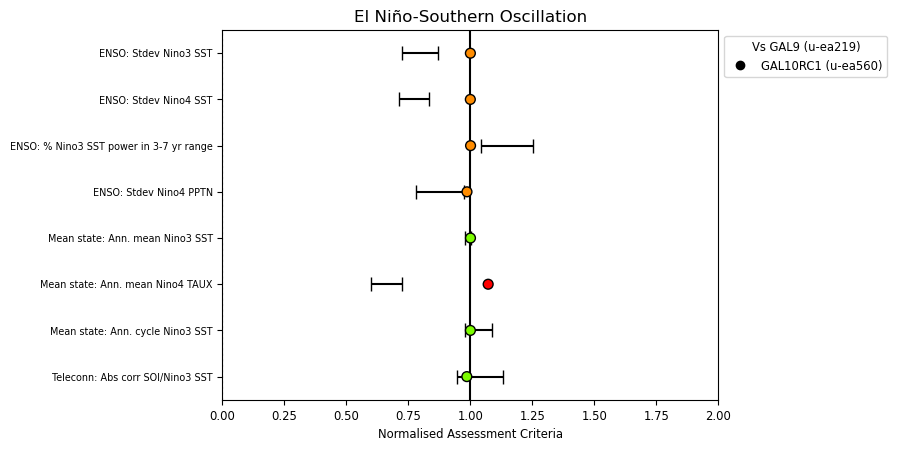
Summary overview of metrics from the ENSO assessment
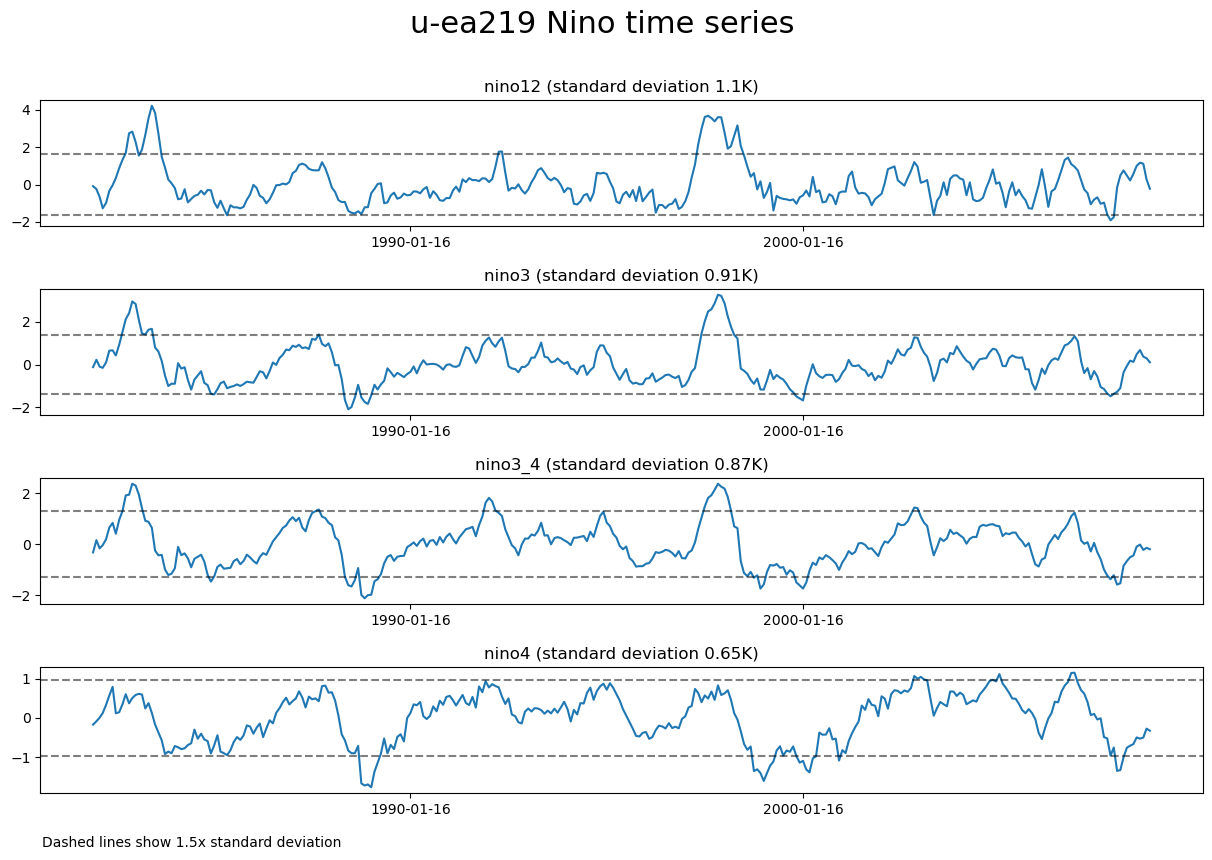
ENSO Timeseries
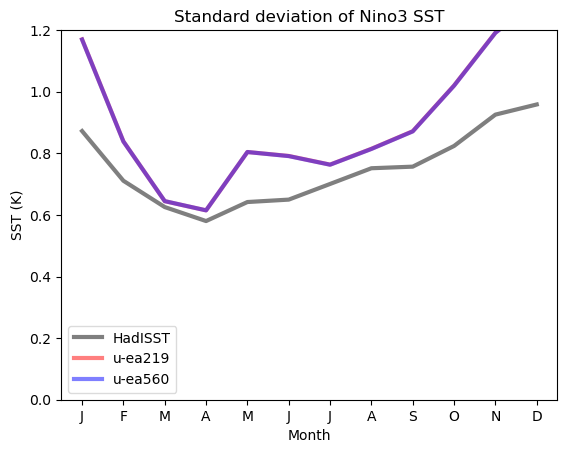
ENSO Phaselocking
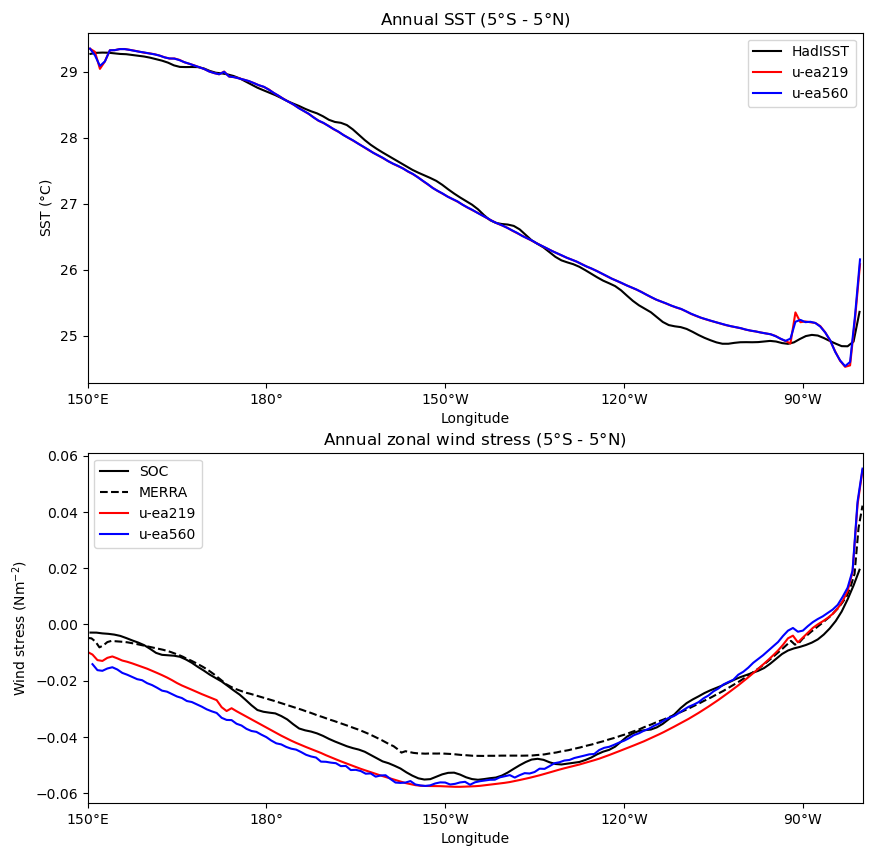
SST and Surface Stress
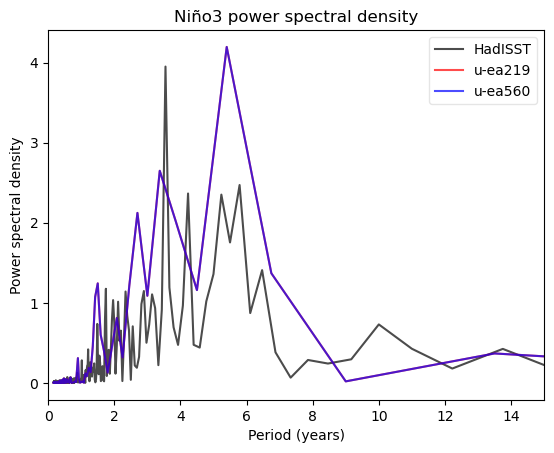
Power Spectral Density
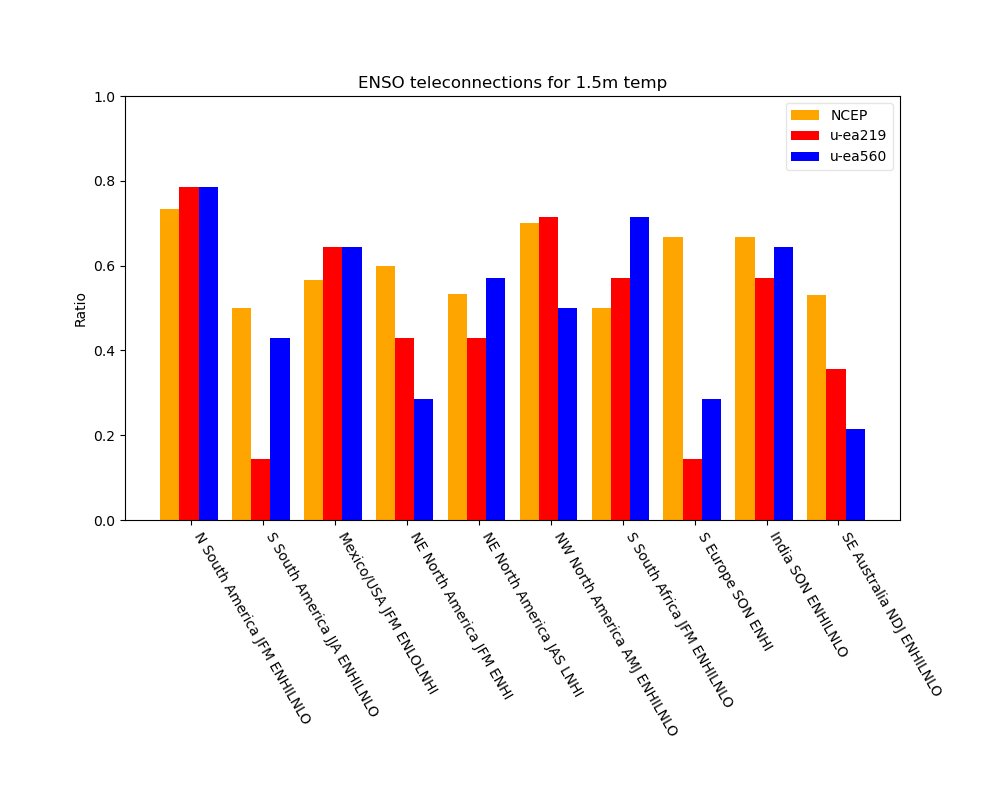
Teleconnections using 1.5m temperature
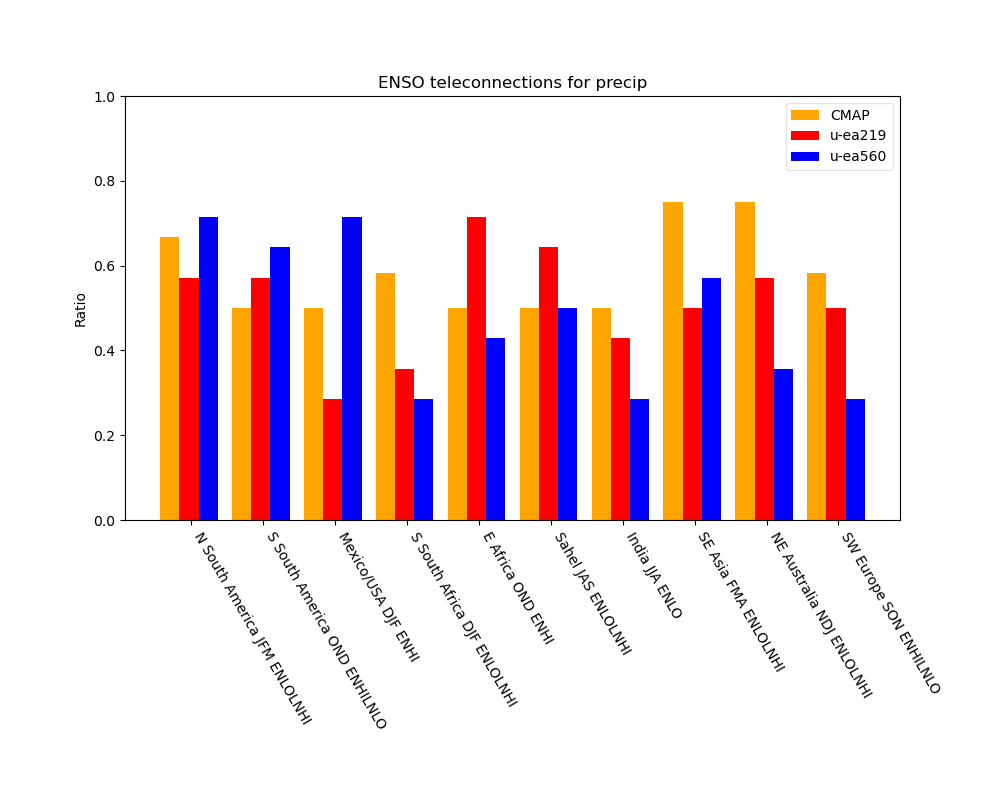
Teleconnections using precipitation