Australia and Maritime Continent
This recipe is available via AutoAssess.
Overview
Assessment of the northern Austrlia (NAus) and Maritime Continent (MC) regions. Also includes some analysis of the Indian Ocean Dipole.
The metrics include: NAus monsoon region; Monsoon metrics; Annual cycles; Maritime continent averages; RMSE and PCC for seasonal rainfall over MC; IOD metrics.
Land fraction information is taken from the model files.
Area-averaged metrics are calculated on the native grid (model and obs). Model and observational data are regridded to the coarsest grid (variable dependent) for plotting and RMS/PCC calculation. This means plots from a N216 model will differ when comparing with another N216 or N96 but metrics should stay the same. Number of vectors (quiver plots) plotted is resolution dependentso higher resolution doesn’t mean more vectors.
Maritime continent domain is 90-160E, 20S-20N to be consistent with the TerraMaris project (Matthews).
Inclusion of JJA fields and metrics is based on Toh et al. (2017) who showed higher biases during this season in the MC.
Diurnal cycle analysis as in global troposphere section but foccussing on land in the maritime continent. The core code remains the same so is regridded to N96.
IOD metrics, timeseries and seasonal averages. This is only really important for coupled model analysis. DMI = IODW - IODE SST anomalies. where IODW=50-70E, 10S-10N. IODE=90-110E, 10S-eq. See McKenna et al. 2020.
Add metrics covering southern Aus in future?
Available recipes and diagnostics
The assessment code is available from the AutoAssess repository.
Overall performance metrics:
NAus (land) DJF precip vs. GCPC/CMAP
NAus (land) DJF temp vs. CRU
mean AUSMI (DJF) vs ERA-I
Standard deviation AUSMI (DJF) vs ERA-I
Correlation of precip with AUSMI (DJF)
Wang index (U850)
St dev Wang index
Webster-Yang index (U850-U200)
St dev Webster-Yang index
MC precip land (ann) vs GPCP
MC precip ocean (ann) vs GPCP
MC precip (ann) vs GPCP
RMS MC precip (ann)
PCC MC precip (ann)
RMS MC precip (DJF)
PCC MC precip (DJF)
RMS MC precip (JJA)
PCC MC precip (JJA)
St dev DMI (IODW-IODE)
Diagnostics (Australian region):
Annual cycle precip
Annual cycle AUSMI
DJF precipitation
DJF temperature
Location of the monsoon shear line (u925 = 0) based on Colman et al., (2011).
DJF MSLP and 850 hPa winds
Maritime continent precipitation metrics:
Precip ann (land): 90-160E 20S-20N
Precip ann (ocean): 90-160E 20S-20N
Precip ann: 90-160E 20S-20N
MC precip ann RMS
MC precip ann PCC
MC precip ann (land) RMS
MC precip ann (ocean) RMS
MC precip djf (land)
MC precip djf (ocean)
MC precip djf
MC precip djf RMS
MC precip djf PCC
MC precip djf (land) RMS
MC precip djf (ocean) RMS
MC precip mam (land)
MC precip mam (ocean)
MC precip mam
MC precip mam RMS
MC precip mam PCC
MC precip mam (land) RMS
MC precip mam (ocean) RMS
MC precip jja (land)
MC precip jja (ocean)
MC precip jja
MC precip jja RMS
MC precip jja PCC
MC precip jja (land) RMS
MC precip jja (ocean) RMS
MC precip son (land)
MC precip son (ocean)
MC precip son
MC precip son RMS
MC precip son PCC
MC precip son (land) RMS
MC precip son (ocean) RMS
Maritime continent diagnostics:
Zonal mean MC precip (80-160E) based on Toh et al., (2017).
JJA precipitation
Diurnal cycle DJF and JJA (phase and amplitude)
Indian Ocean Dipole metrics (vs HadISST):
DMI STD
IODW djf
IODE djf
DMI STD djf
IODW mam
IODE mam
DMI STD mam
IODW jja
IODE jja
DMI STD jja
IODW son
IODE son
DMI STD son
Indian Ocean Dipole diagnostics:
Annual cycle IODW
Annual cycle IODE
Annual cycle standard deviation of DMI
Timeseries IODW, IODE, DMI
SON mean SST and surface wind stress
User settings in recipe
There are no user settings for this recipe
Variables
Variable/Field name |
realm |
frequency |
Comment |
|---|---|---|---|
Total precipitation rate |
Atmosphere |
monthly mean |
|
Zonal (u) wind speed |
Atmosphere |
monthly mean |
925, 850 and 200 hPa. |
Meridinal (v) wind speed |
Atmosphere |
monthly mean |
850 hPa only |
Air temperature at 1.5m |
Atmosphere |
monthly mean |
|
Mean sea level pressure |
Atmosphere |
monthly mean |
|
surface temperature |
Atmosphere |
monthly mean |
|
surface wind stress (x-comp) |
Atmosphere |
monthly mean |
1st level only (surface) |
surface wind stress (y-comp) |
Atmosphere |
monthly mean |
1st level only (surface) |
Observations and reformat scripts
GPCP2 monthly data (Adler et al., 2003): Jan 1979 - Dec 2006, 2.5x2.5 deg resolution, units: kg/m2/day.
CMAP/O monthly data (Xie and Arkin, 1997): Jan 1979 - Dec 2001, 2.5x2.5 deg resolution, units: kg/m2/day.
TRMM data (for diurnal cycle)
ERA-Interim monthly data (Dee et al., 2011)
MERRA monthly data (Rienecker et al., 2011)
HadISST and CRU from Met Office
References
Adler, R.F. et al., 2003: The Version 2 Global Precipitation Climatology Project (GPCP) Monthly Precipitation Analysis (1979-Present). J. Hydrometeor., 4,1147-1167.
Colman, R. A., A. F. Moise, and L. I. Hanson (2011), Tropical Australian climate and the Australian monsoon as simulated by 23 CMIP3 models, J. Geophys. Res., 116, D10116, doi:10.1029/2010JD015149.
Kajikawa, Y., Wang, B. and Yang, J. (2010), A multi‐time scale Australian monsoon index. Int. J. Climatol., 30: 1114-1120. doi:10.1002/joc.1955
Narsey, S.Y., Brown, J. R.,Colman,R.A., Delage, F., Power, S. B., Moise, A. F., & Zhang, H. (2020). Climate change projections for the Australian monsoon from CMIP6 models. Geophysical Research Letters, 47, e2019GL086816.
McKenna, S., Santoso, A., Gupta, A.S. et al. Indian Ocean Dipole in CMIP5 and CMIP6: characteristics, biases, and links to ENSO. Sci Rep 10, 11500 (2020).
Toh, Y.Y., Turner, A.G., Johnson, S.J. et al. Maritime Continent seasonal climate biases in AMIP experiments of the CMIP5 multimodel ensemble. Clim Dyn 50, 777–800 (2018).
Xie and Arkin 1997. Global precipitation: a 17-year monthly analysis based on gauge observations, satellite estimates and numerical model outputs. BAMS vol 78, 2539-2558.
Example plots
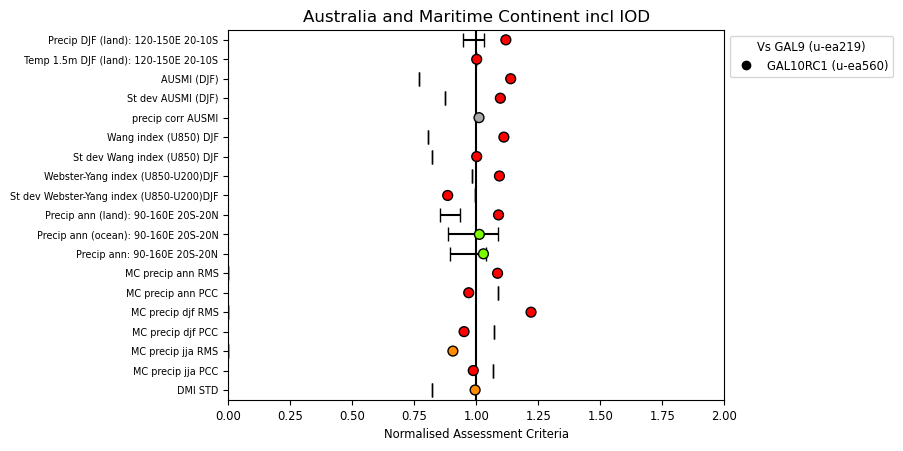
Summary overview of metrics from the Australia assessment
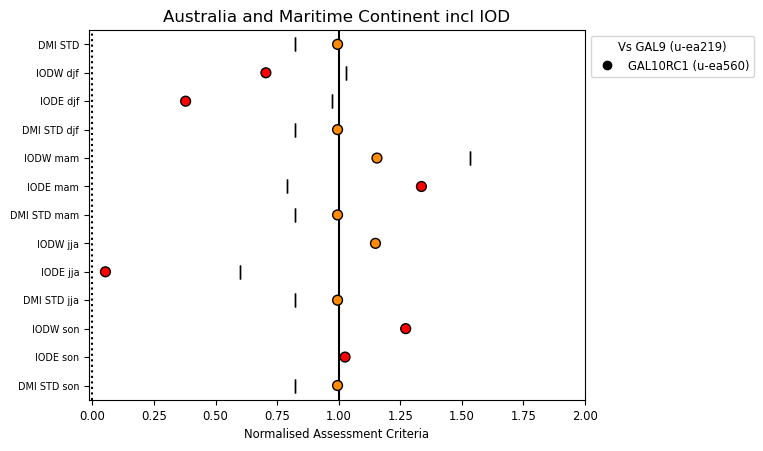
Indian Ocean Dipole metrics
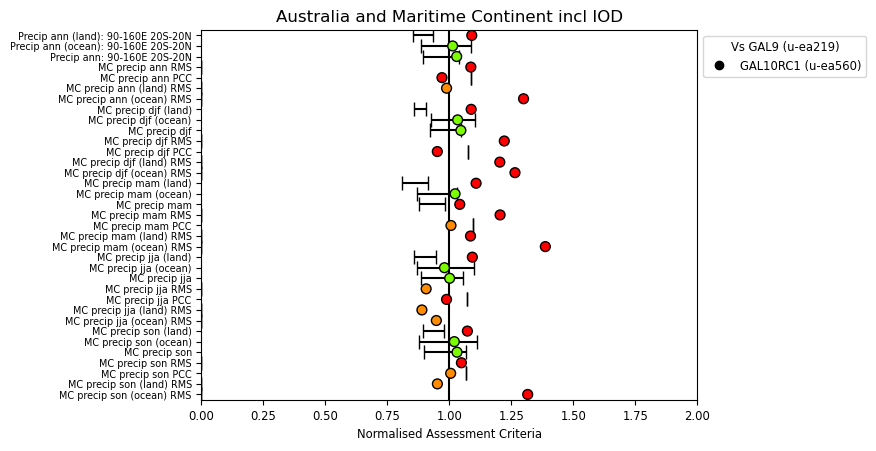
Maritime Continent metrics
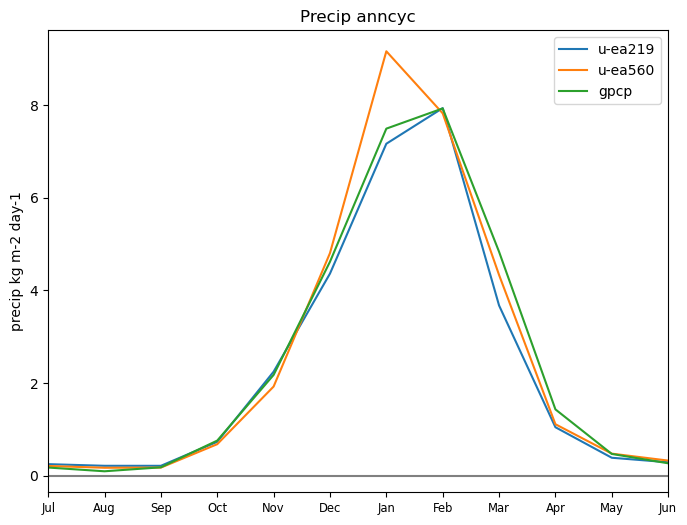
Annual cycle of precipitation over NAus land
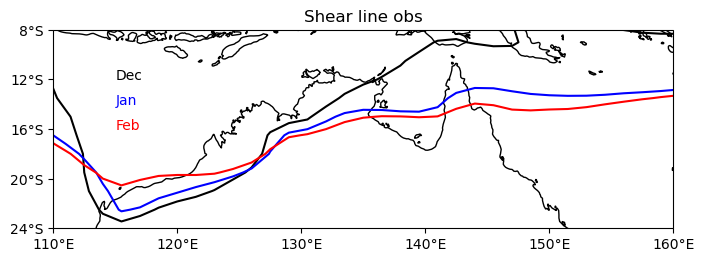
Location of monsoon shearline (ERA-Interim)
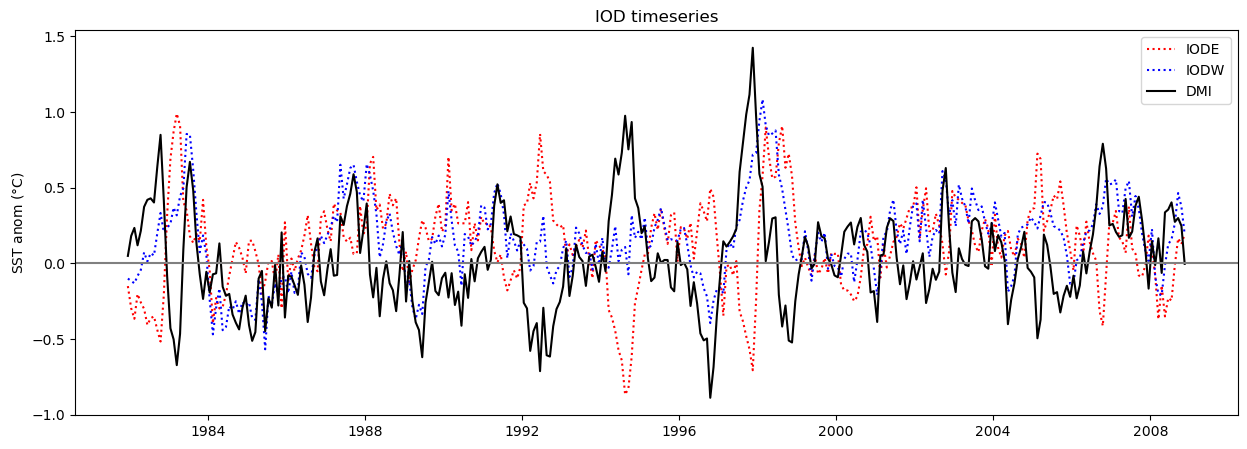
Timeseries of IOD (IODW, IODE, DMI) from HadISST