Stratosphere
This recipe is available via AutoAssess.
Overview
Polar night jet / easterly jet strengths are defined as the maximum / minimum wind speed of the climatological zonal mean jet, and measure how realistic the zonal wind climatology is in the stratosphere.
Extratropical temperature at 50hPa (area averaged poleward of 60 degrees) is important for polar stratospheric cloud formation (in winter/spring), determining the amount of heterogeneous ozone depletion simulated by models with interactive chemistry schemes.
The Quasi-Biennial Oscillation (QBO) is a good measure of tropical variability in the stratosphere. Zonal mean zonal wind at 30hPa is used to define the period and amplitude of the QBO.
The tropical tropopause cold point (100hPa, 10S-10N) temperature is an important factor in determining the stratospheric water vapour concentrations at entry point (70hPa, 10S-10N), and this in turn is important for the accurate simulation of stratospheric chemistry and radiative balance.
Available recipes and diagnostics
The assessment code is available from the AutoAssess repository.
Note that the Stratosphere recipe has already been migrated to ESMValTool as an example of the process of migrating AutoAssess assessments.
Performance metrics:
Polar night jet: northern hem (January) vs. ERA Interim
Polar night jet: southern hem (July) vs. ERA Interim
Easterly jet: southern hem (January) vs. ERA Interim
Easterly jet: northern hem (July) vs. ERA Interim
50 hPa temperature: 60N-90N (DJF) vs. ERA Interim
50 hPa temperature: 60N-90N (MAM) vs. ERA Interim
50 hPa temperature: 90S-60S (JJA) vs. ERA Interim
50 hPa temperature: 90S-60S (SON) vs. ERA Interim
QBO period at 30 hPa vs. ERA Interim
QBO amplitude at 30 hPa (westward) vs. ERA Interim
QBO amplitude at 30 hPa (eastward) vs. ERA Interim
100 hPa equatorial temp (annual mean) vs. ERA Interim
100 hPa equatorial temp (annual cycle strength) vs. ERA Interim
70 hPa 10S-10N water vapour (annual mean) vs. ERA-Interim
Diagnostic plot:
Age of stratospheric air vs. observations from Andrews et al. (2001) and Engel et al. (2009)
User settings in recipe
There are no user settings for this recipe
Variables
ua (atmos, monthly mean, longitude latitude pressure time)
ta (atmos, monthly mean, longitude latitude pressure time)
hus (atmos, monthly mean, longitude latitude pressure time)
“age of air” (atmos, monthly mean, longitude latitude height time)
Variable/Field name |
realm |
frequency |
Comment |
|---|---|---|---|
Zonal mean zonal wind |
Atmosphere |
monthly mean |
|
Zonal mean temperature |
Atmosphere |
monthly mean |
|
Age of stratospheric air |
Atmosphere |
monthly mean |
Observations and reformat scripts
ERA-Interim (ta, hus)
MERRA (ta, hus)
“Age of Air” sources?
ERA-Interim data (Dee et al., 2011) and MERRA data (Rienecker et al., 2011) can be obtained online from ECMWF and NASA respectively. Monthly mean zonal mean U and T data are required.
Age of air data (Andrews et al., 2001; Engel et al., 2009) is as provided in age_of_air.py of the stratospheric area of auto_assess.
References
Andrews, A. E., and Coauthors, 2001: Mean ages of stratospheric air derived from in situ observations of CO2, CH4, and N2O. J. Geophys. Res., 106 (D23), 32295-32314.
Dee, D. P., and Coauthors, 2011: The ERA-Interim reanalysis: configuration and performance of the data assimilation system. Q. J. R. Meteorol. Soc, 137, 553-597, doi:10.1002/qj.828.
Engel, A., and Coauthors, 2009: Age of stratospheric air unchanged within uncertainties over the past 30 years. Nat. Geosci., 2, 28-31, doi:10 .1038/NGEO388.
Rienecker, M. M., and Coauthors, 2011: MERRA: NASA’s Modern-Era Retrospective Analysis for Research and Applications. J. Climate, 24, 3624-3648, doi:http://dx.doi.org/10.1175/JCLI-D-11-00015.1.
Example plots
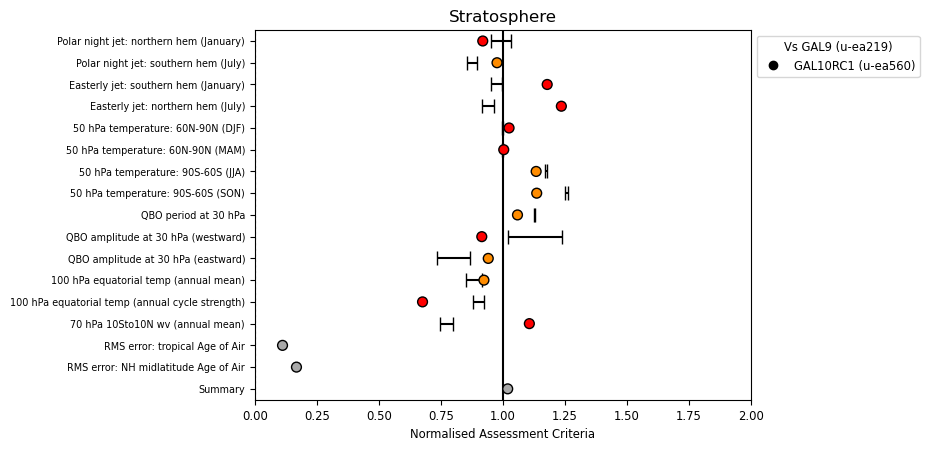
Summary overview of metrics from the Stratosphere assessment.
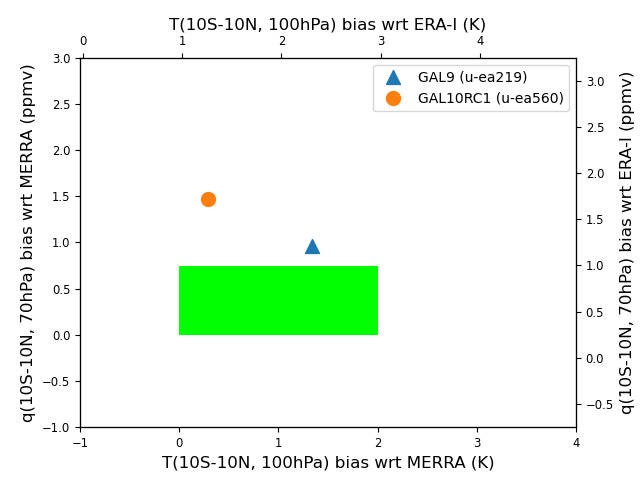
Comparison of temperature and humidity against re-analysis.
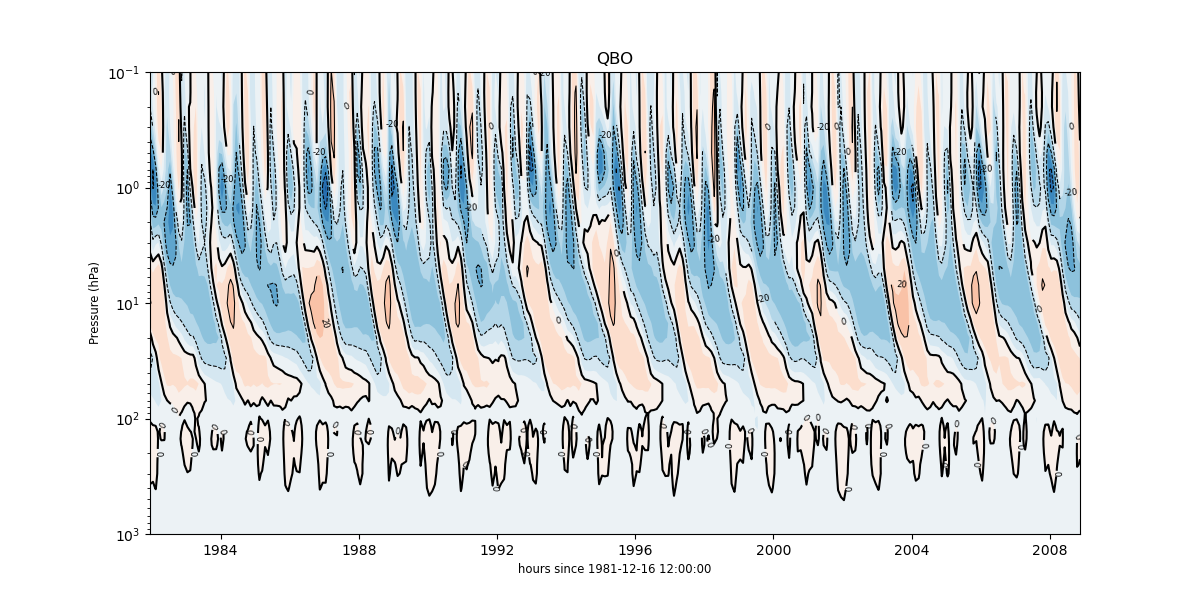
Height-Timeseries of QBO
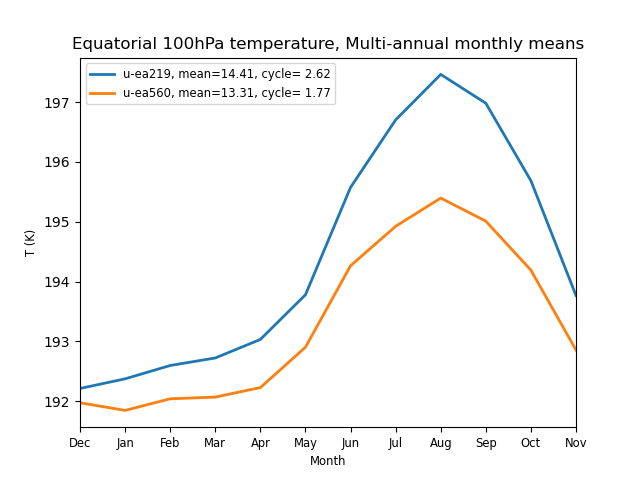
Equatorial temperature at 100hPa, multi-annual monthly means
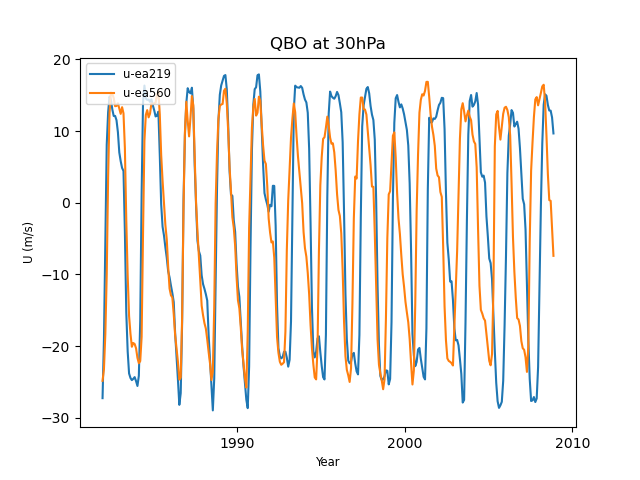
QBO at 30hPa comparison
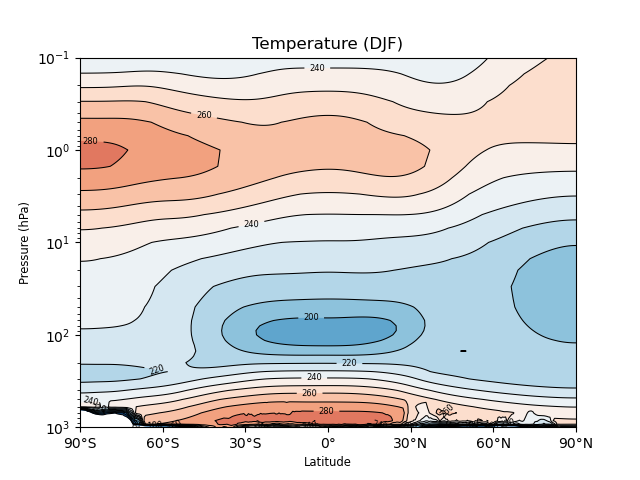
Zonal mean temperature
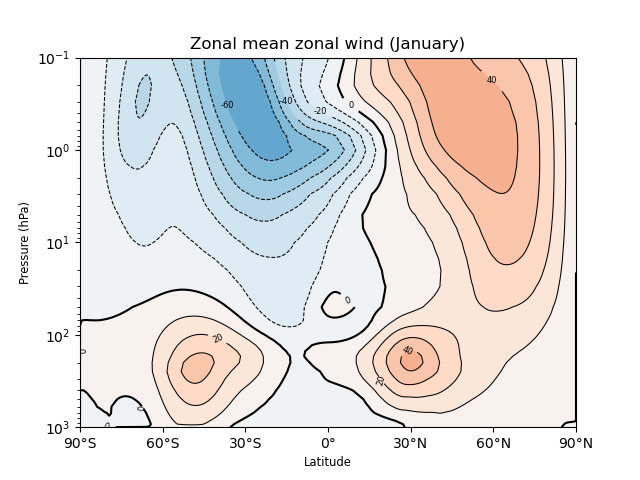
Zonal mean zonal wind
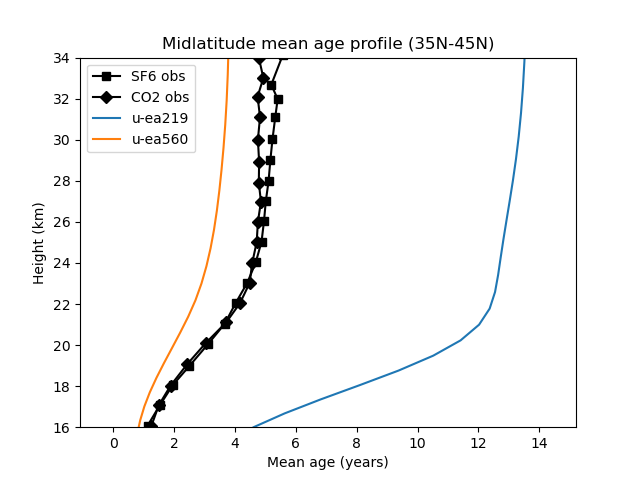
Age of Air in Mid-Latitudes
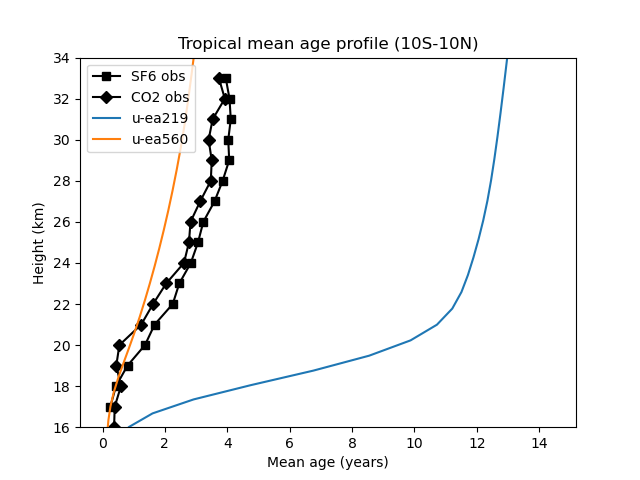
Age of Air in the Tropics